I used instructions found in the PHPStorm docs with the xdebug3 set of code.
I’m just going to mention some specifics that aren’t listed in the PHPStorm docs or that I found particularly key.
Setting up an SSH tunnel
https://www.jetbrains.com/help/phpstorm/remote-debugging-via-ssh-tunnel.html#set-up-an-ssh-tunnel-to-the-remote-machine
This sets up a way for your remote server to talk to your local computer.
When you connect this way it’s simply going to open up a new connection in your terminal and then sit there. It has to stay open while you debug.
I have an ssh profile file setup and use this for my connection:
Host easyorthosandbox-qa-xdebug
  Hostname <hostnamehere>
  User kclark
  Port 22
  ServerAliveInterval 60
  IdentityFile <path/to/identity/file>
  RemoteForward 9003 localhost:9003
Local codebase
You need to have an exact copy of the codebase that you are going to debug on the remote server. Specifically the files you are going to debug needs to be exact, otherwise the breakpoint in your local code will still break there, but the variables and where the debugger steps to as you go from line to next line will be off and not make sense. Even one line difference can be slightly confusing, although I have done that. More importantly, if your files are not in sync your breakpoints might not break as they are set on lines that don’t have php code to execute on the remote server.
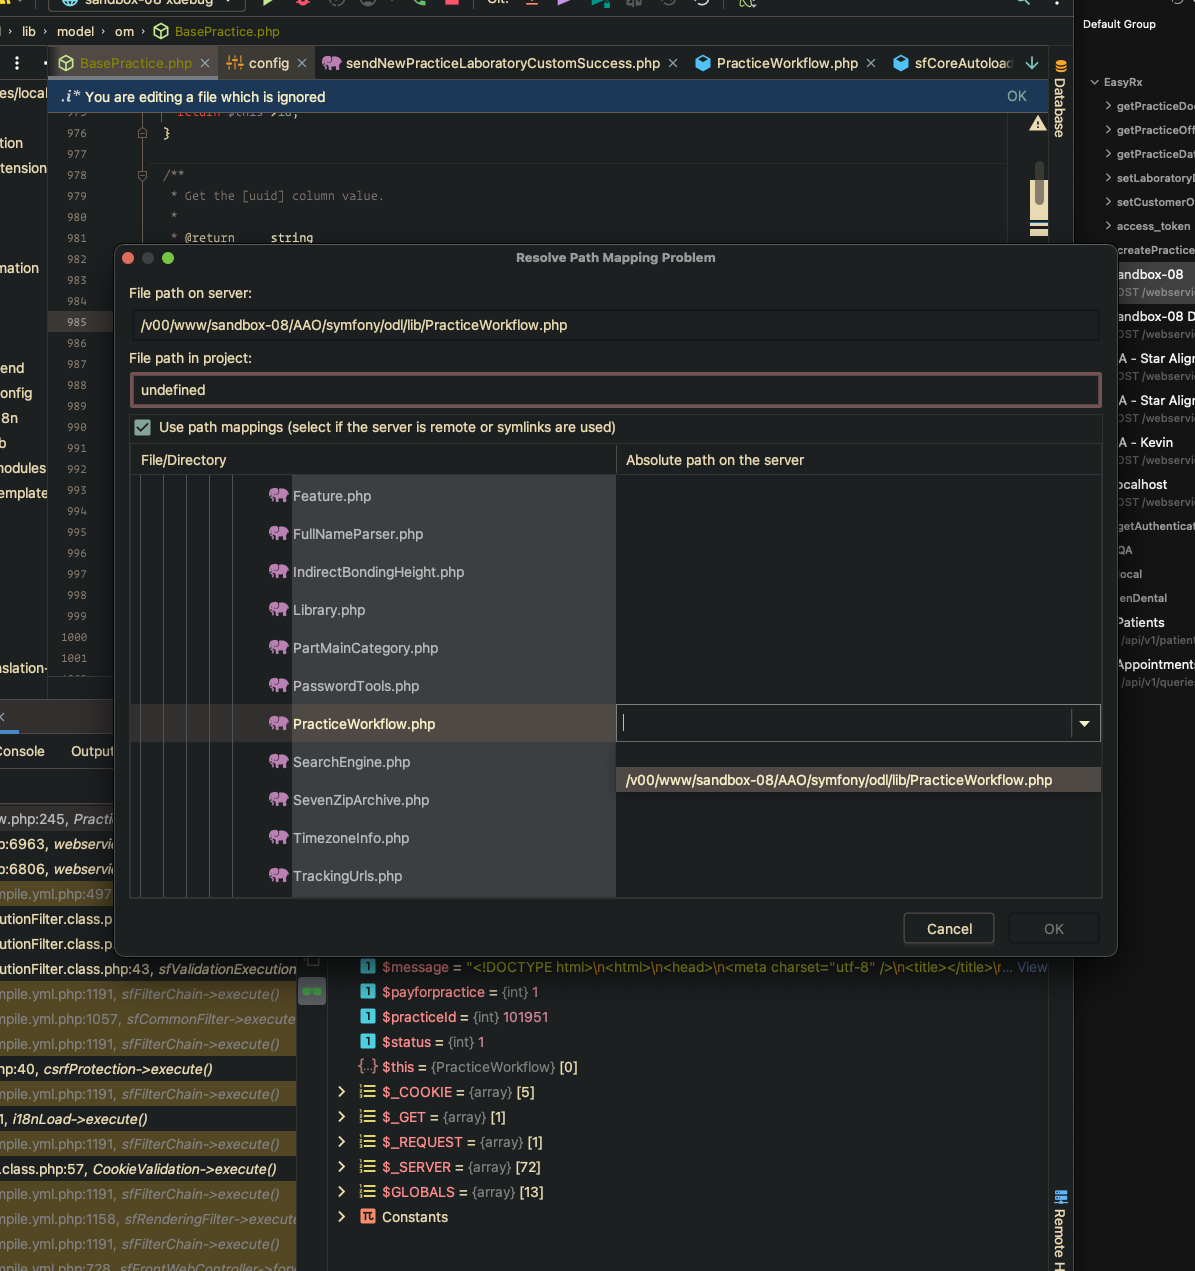
Remote file path mapping
When I connect to a new app I have to set the path mappings as my paths locally are different than the ones on the remote server.
https://www.jetbrains.com/help/phpstorm/remote-debugging-via-ssh-tunnel.html#no-mapping

It seems like you can set a directory mapping at a higher level than the file is at and it will fix the mapping for all files within that directory, so you don’t need to do it for each individual file.
API/Postman/Paw debugging
To debug a postman/paw/api call use one of these methods to tell xdebug that you want to debug with the call:https://stackoverflow.com/a/19147935
“attempt to debug every php script.” May not be preferable as it will slow down every call.
I used XDEBUG_SESSION_START=PHPSTORM as a url query and it worked.
Multiple Users
This is something I have yet to work out.
Xdebug only supports connecting to a single IP address, and does not automatically connect back to the IP address that runs the browser because of security reasons.
Here’s a couple resources:
https://intellij-support.jetbrains.com/hc/en-us/community/posts/360010264920-xdebug-multiple-developers-php-storm-dbgpproxy
https://www.jetbrains.com/help/phpstorm/multiuser-debugging-via-xdebug-proxies.html
Resources
https://www.jetbrains.com/help/phpstorm/remote-debugging-via-ssh-tunnel.html
https://www.jetbrains.com/help/phpstorm/configuring-xdebug.html#downloadAndInstall
https://xdebug.org/docs/install#linux
https://www.jetbrains.com/help/phpstorm/multiuser-debugging-via-xdebug-proxies.html
https://xdebug.org/docs/dbgpProxy
https://xdebug.org/download#dbgpProxy
https://www.jetbrains.com/help/phpstorm/xdebug-proxy.html
https://chrome.google.com/webstore/detail/xdebug-helper/eadndfjplgieldjbigjakmdgkmoaaaoc